Case Studies of Public Markets Analysis

Technology, Media, and Video Games

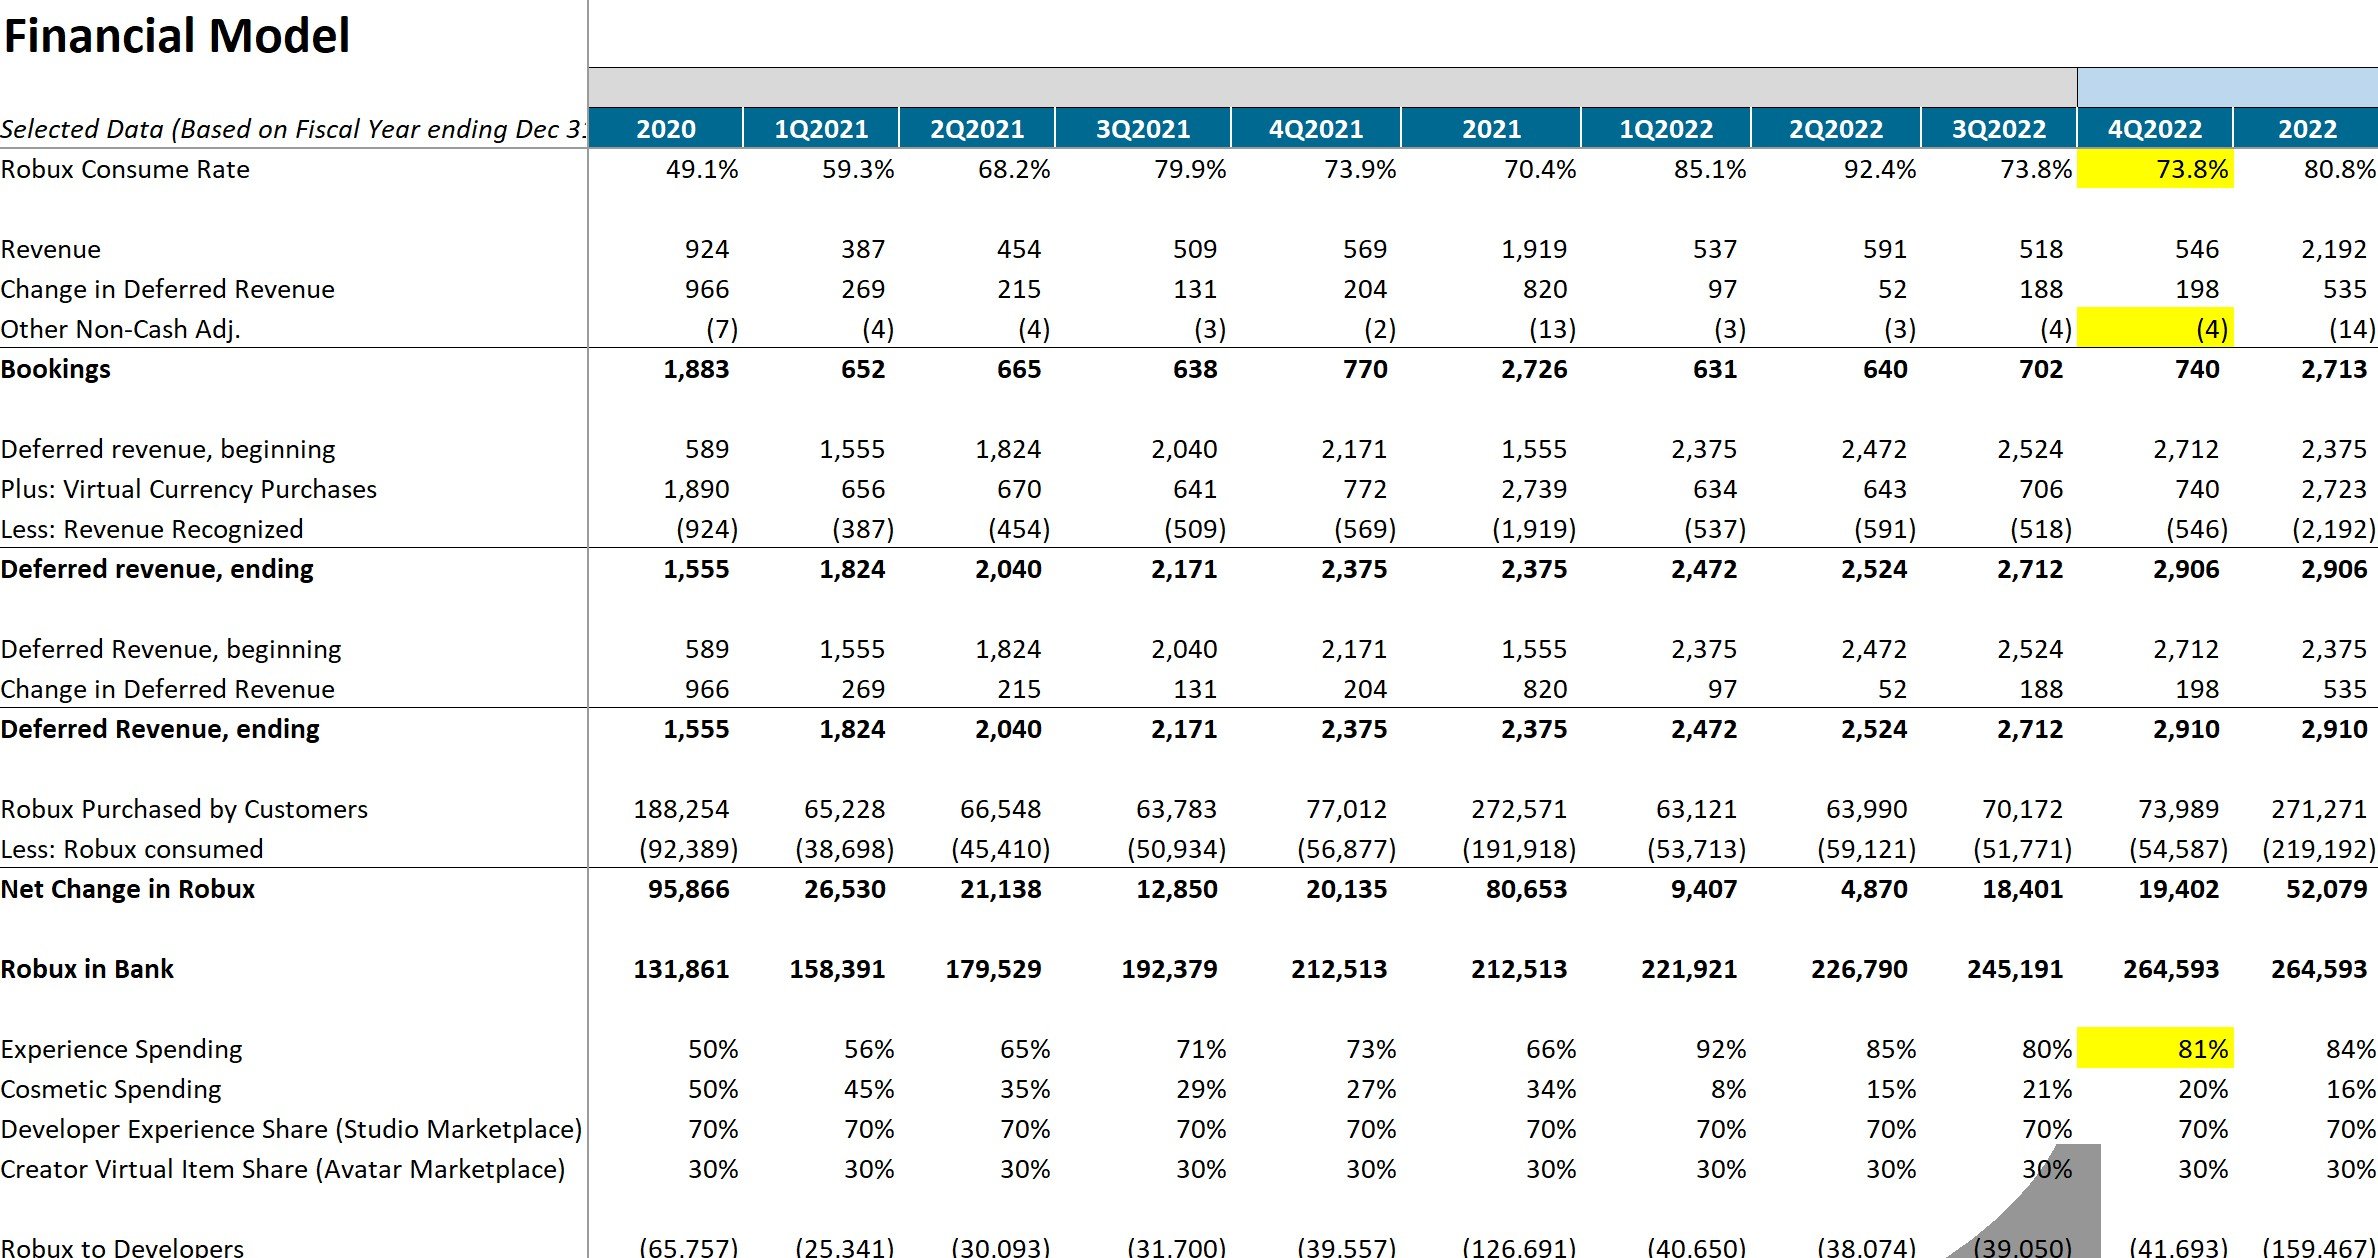
A financial model table for a company's fiscal data from 2020 to 2022, showing metrics like Robux consume rate, revenue, bookings, deferred revenue, and Robux purchased. Selected values are highlighted in yellow for emphasis.
Table displaying financial model including levered free cash flow, retail segment data, Texas segment details, and capacity factors for various energy sources. Highlights show percentages and values for solar and East/Sunset whole generation.

Financial Institutions and Banks

Energy and Power Plants

Financial model spreadsheet showing historical and projection periods for diamond sales from 2017 to 2023, including data on volume, transaction value, and revenue categories for natural and lab-grown diamonds.
Spreadsheet showing a financial model with data from 2020 to 2022, including loans, securities, interest income, deposits, and interest costs. Columns represent quarters and years, while rows detail different financial metrics and ratios.

Consumer and Retail

Contact Us

If you have a question about scheduling a consultation, please complete the contact form below and a member of our team will answer your question over email as soon as possible.
Four hands clasped together in a circle, symbolizing teamwork.